Data Visualization Settings
Attach a workbook
First we have to attach a workbook to the presentation. We do this by starting the OfficeReports-app and click 'New' on the right. In case you are going to work with raw-data, OfficeReports will create and attach a workbook automatically. Please follow the instructions.
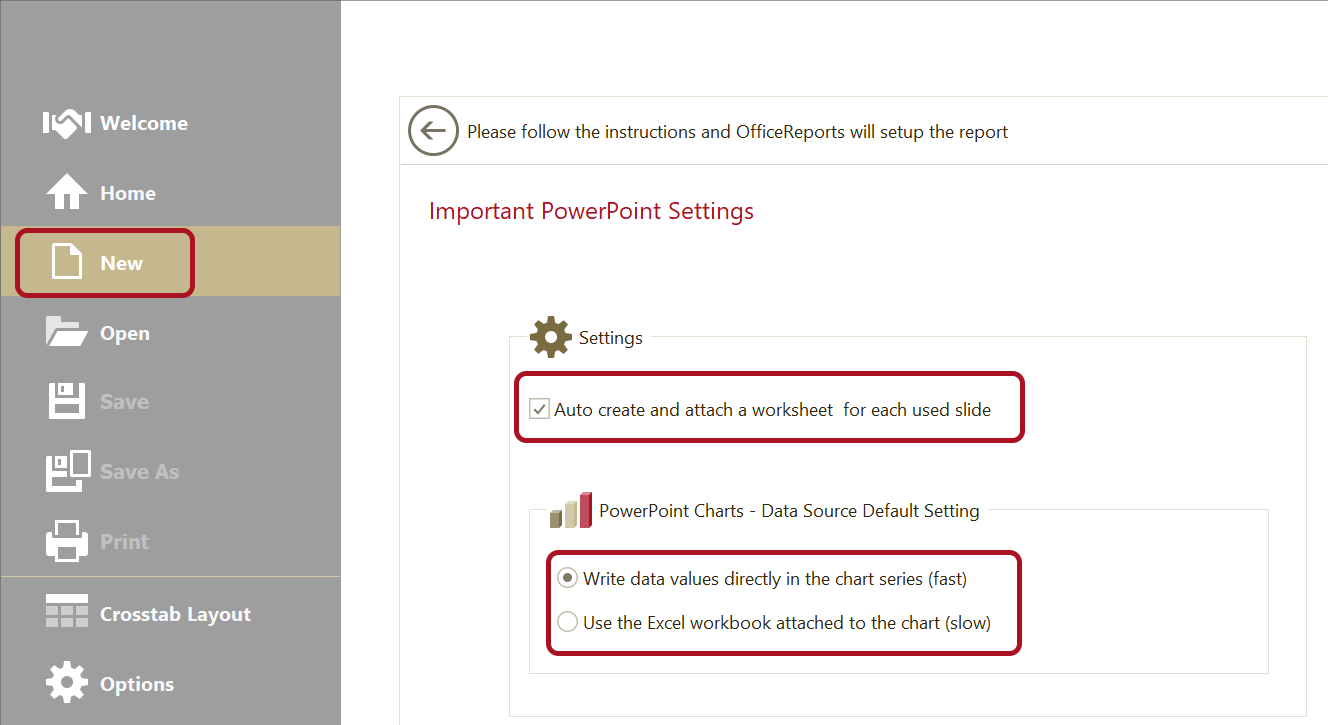
By default, OfficeReports will write data directly in the charts. Change this setting if you want to be able to edit the chart data in the chart-workbook
By default, OfficeReports will automatically create and attach a worksheet to each slide you are working with. This is important if you want to improve your productivity and use the 'Copy Slide (Setup)' functionality. Change this settings if you want to control and organize the worksheets yourself.
(Re)Organize the data
In case you are using raw data, you have to create crosstabs first. Read more about creating crosstab in PowerPoint.
If you are using an other data source, it might be necessary to reorganize the data. Read more about Lookup Tables, Lookup Ranges and Linked Ranges. And read more about handling crosstabs created using other tools.
Populate and Link
The attached workbook will be shown in the 'Workbook Pane' in PowerPoint. You can pop-out the workbook by clicking the ![]() icon, so it floats in it's own form. The functionality from the Workbook Form is identical to the Workbook Pane. By clicking the
icon, so it floats in it's own form. The functionality from the Workbook Form is identical to the Workbook Pane. By clicking the  icon in the Workbook Form, you can open the workbook in Excel.
Using the Workbook Pane or Form
Now select the shape, table or chart on the slide, select a range of data in the worksheet and right-click in the selected range. Read more: Populate Charts, Populate Tables and Populate Shapes
Using Excel
When using Excel, select a range in Excel and click the 'Populate and Link' button in the OfficeReports ribbon tab in PowerPoint: 